Dashboards for visibility of automation testing metrics
After the beta launch of Test Reporting and Analytics, I collaborated with a newly joined Product Manager to design and implement a Dashboards feature. My role focused on defining direction and design execution to enhance user experience to meet evolving needs.
Key Results
- ↑ Attracted new customers within the first month of launch.
- ↑ Differentiated the product from competitors.
- ↑ Developed reusable design patterns for the Design System.
Role & Time
- Senior Product Designer
- 2 months
Overview
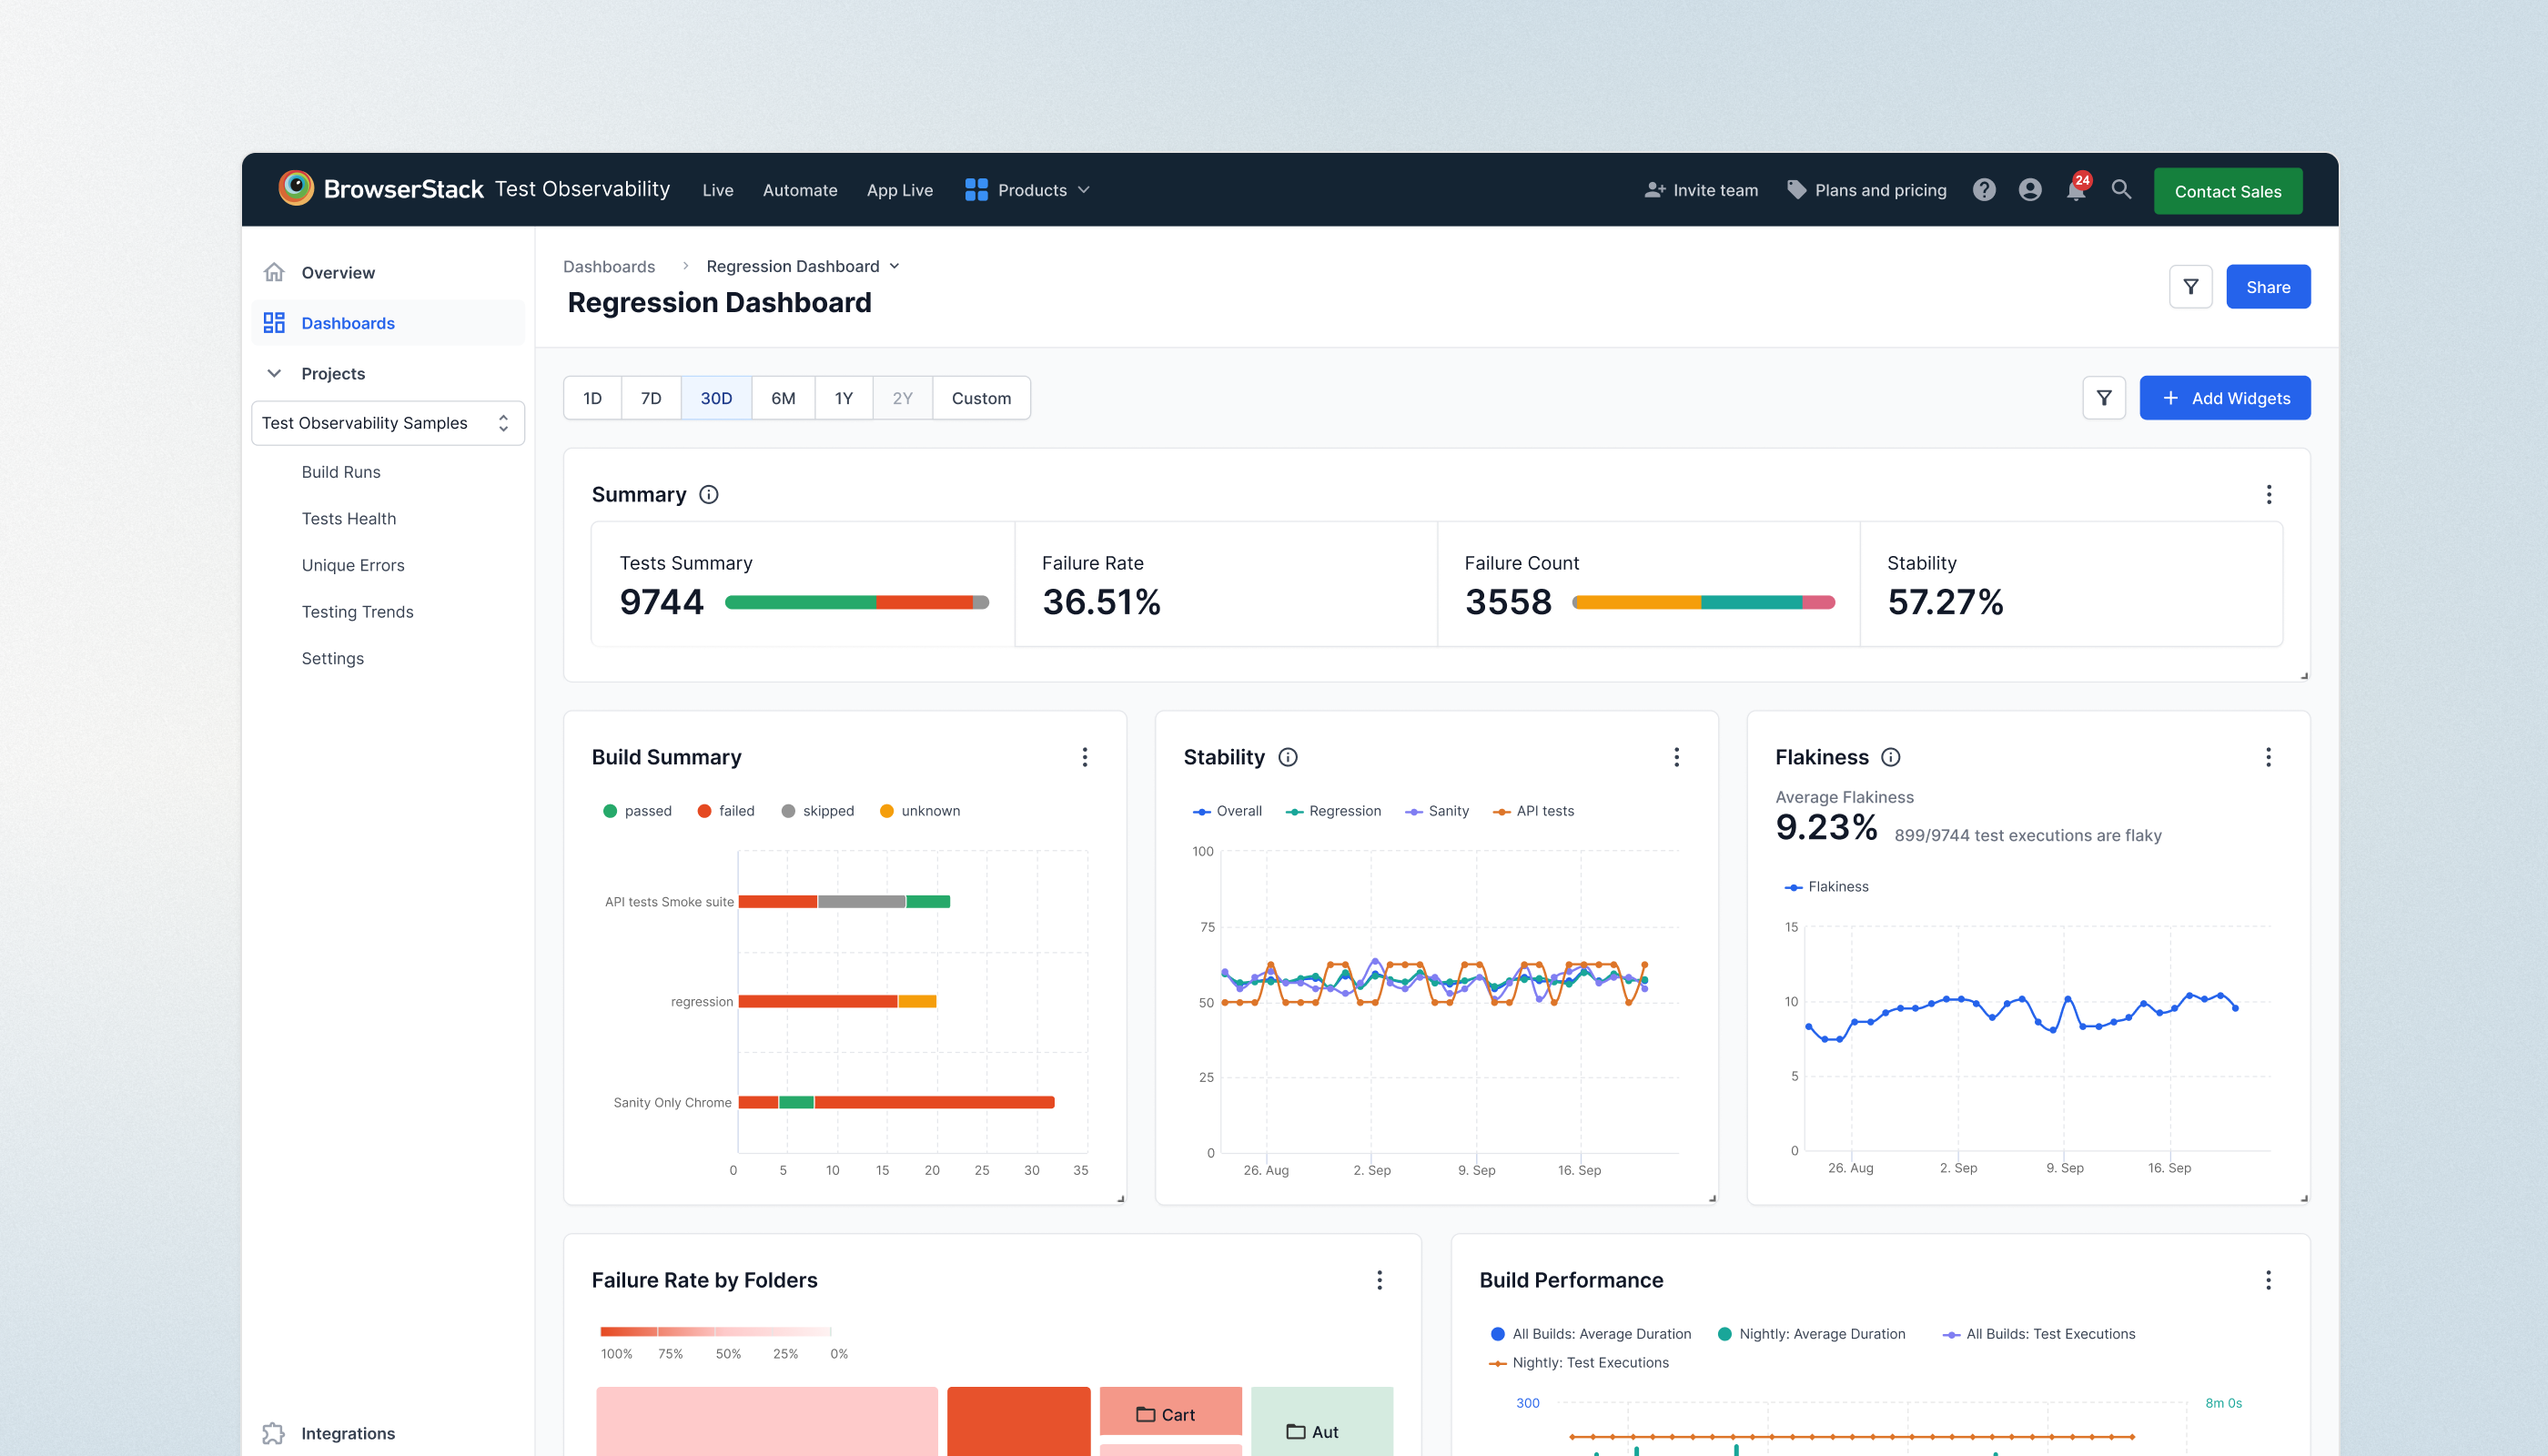
During Beta, Test Reporting and Analytics primarily helped QE engineers debug tests efficiently. We provided pre-built dashboards that displayed automation trends.
However, as enterprise teams and QA managers adopted the product, we identified a new opportunity—QA Analytics. These users needed deeper insights and custom reporting to showcase data to leadership and monitor team performance.
Research & Discovery: Deep-diving on needs
Understanding User Needs
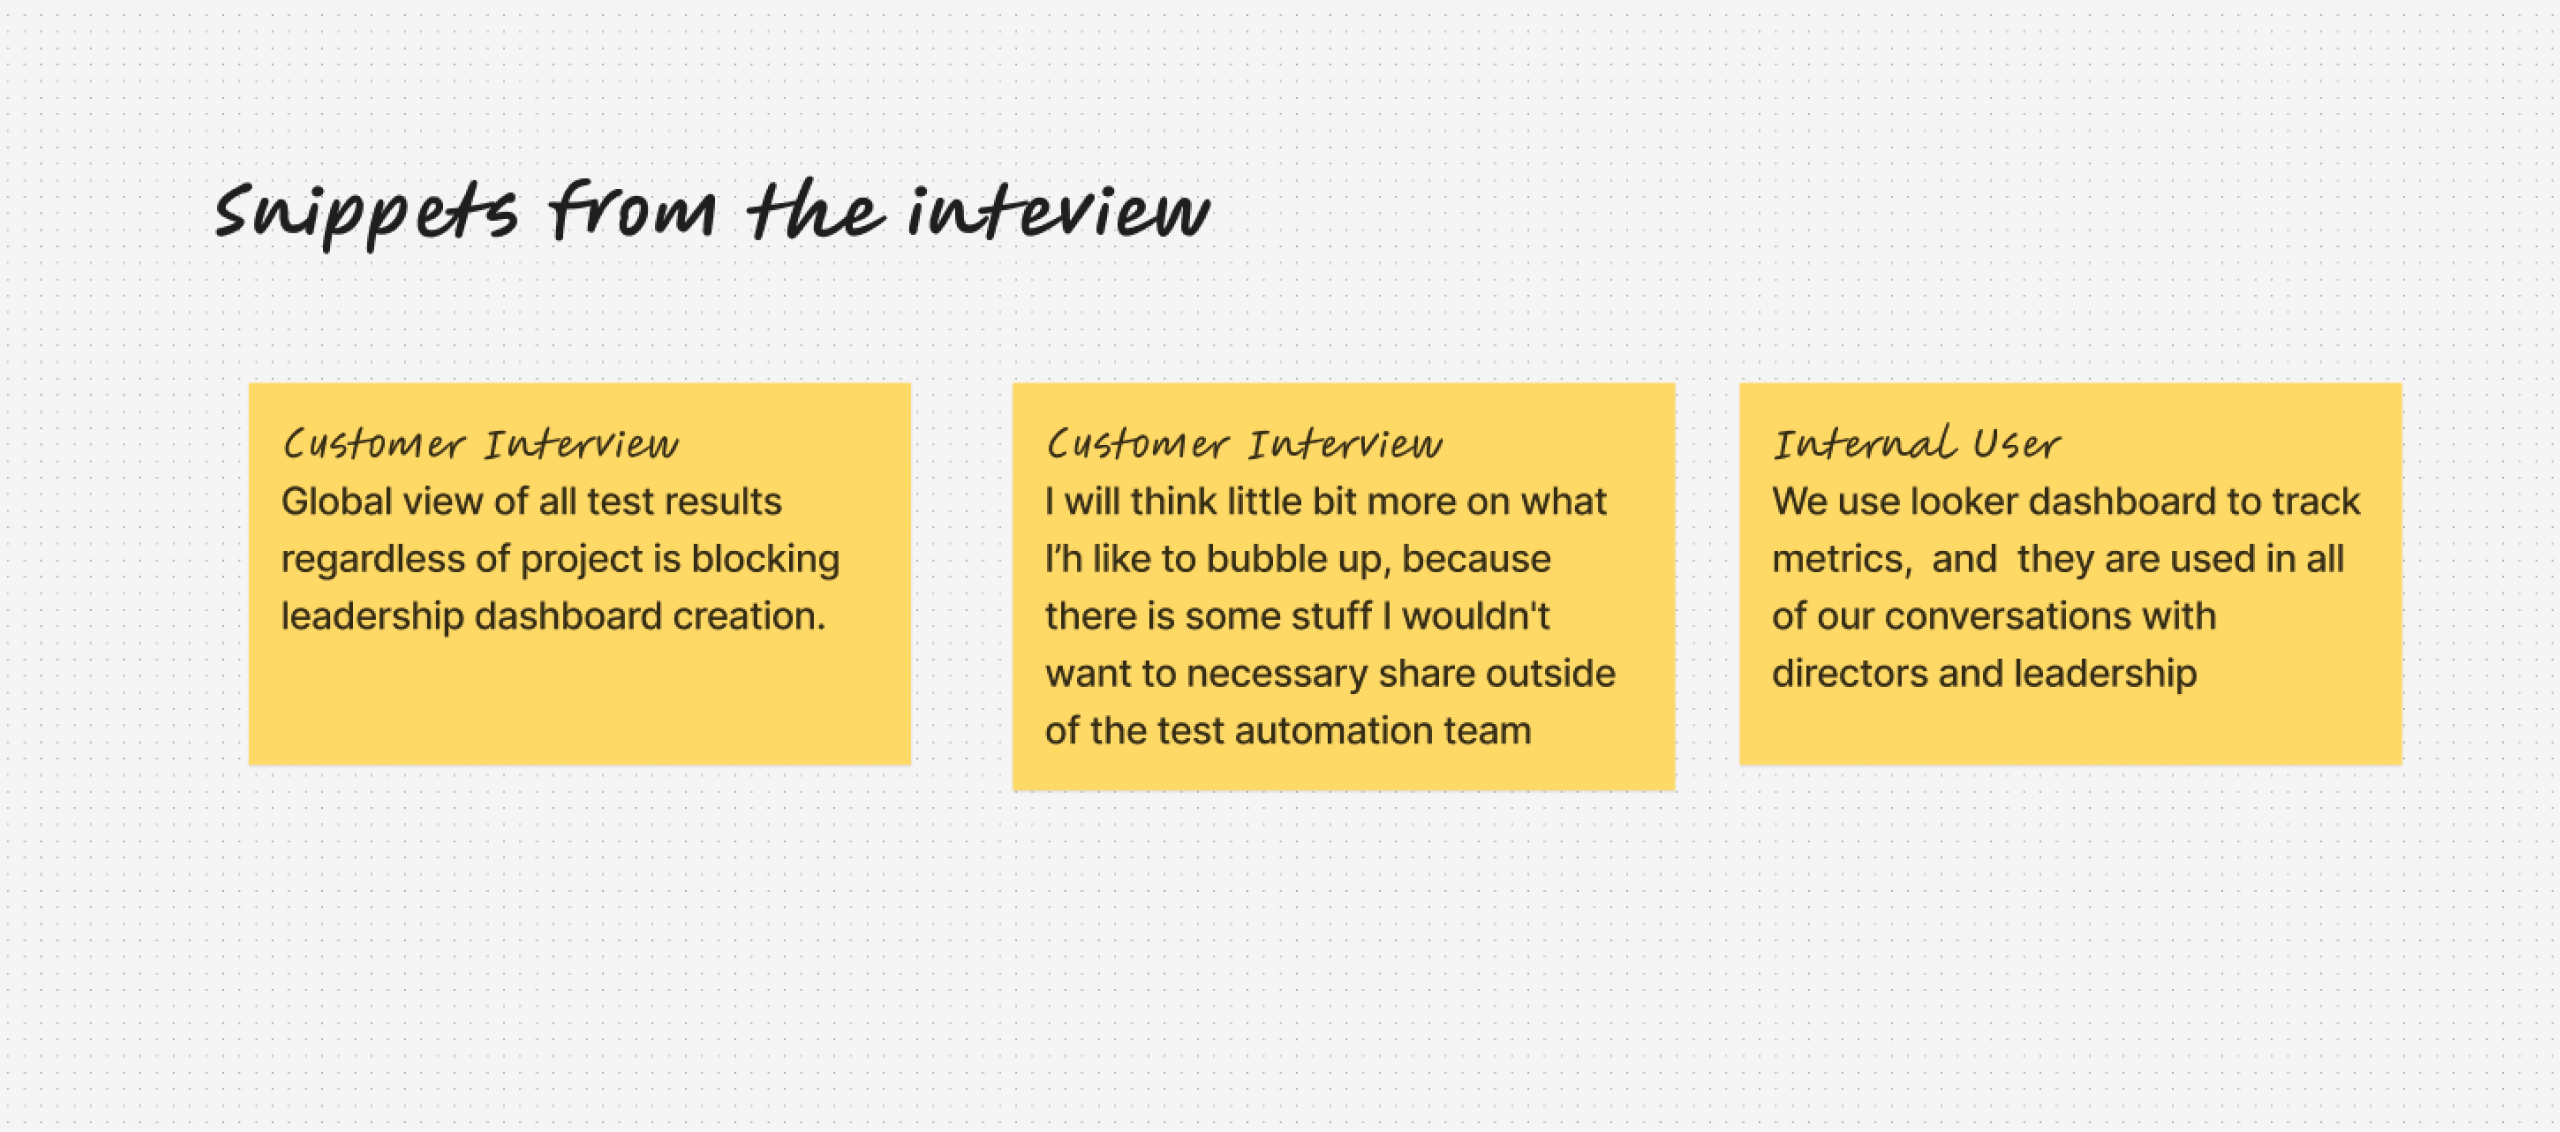
To uncover user pain points, I analyzed more than 10 recorded customer interactions and interviewed 4 internal QA managers / leads.
Customers wanted a way to present key insights while focusing on specific data , not everything. For e.g. Managers needed to monitor their teams' work, while Testing Architects prioritized showcasing flakiness to leadership.
Secondary Research
I analyzed multiple tools to understand dashboard creation approaches. There was no standard method—some tools offered inline editing, while others used save-on-the-fly functionality. Each tool's context influenced its unique solution.
Summary
- → Widget Management— Developer–focused tools like Sentry, Grafana, and Elastic commonly use a dedicated page for widget creation.
- → Dashboard Listing Views – Table and grid views were the standard formats for listing dashboards.
- → Templates – Providing ready-to-use templates helped users get started quickly.
Design Explorations
I began my exploration journey by breaking down user tasks to evaluate different approaches.
I focused on the creation of workflows first as patterns for CRUD were already defined and did not require re-inventing the wheel.
I created variations for: Dashboard listing , creation & widget creation
I reviewed these ideas with designers and stakeholders, most of the feedback belong to widget creation leading to three key learnings:
Directionally we wanted to provide faster and more flexible way to build dashboards.
Iterate>Iterate>Iterate
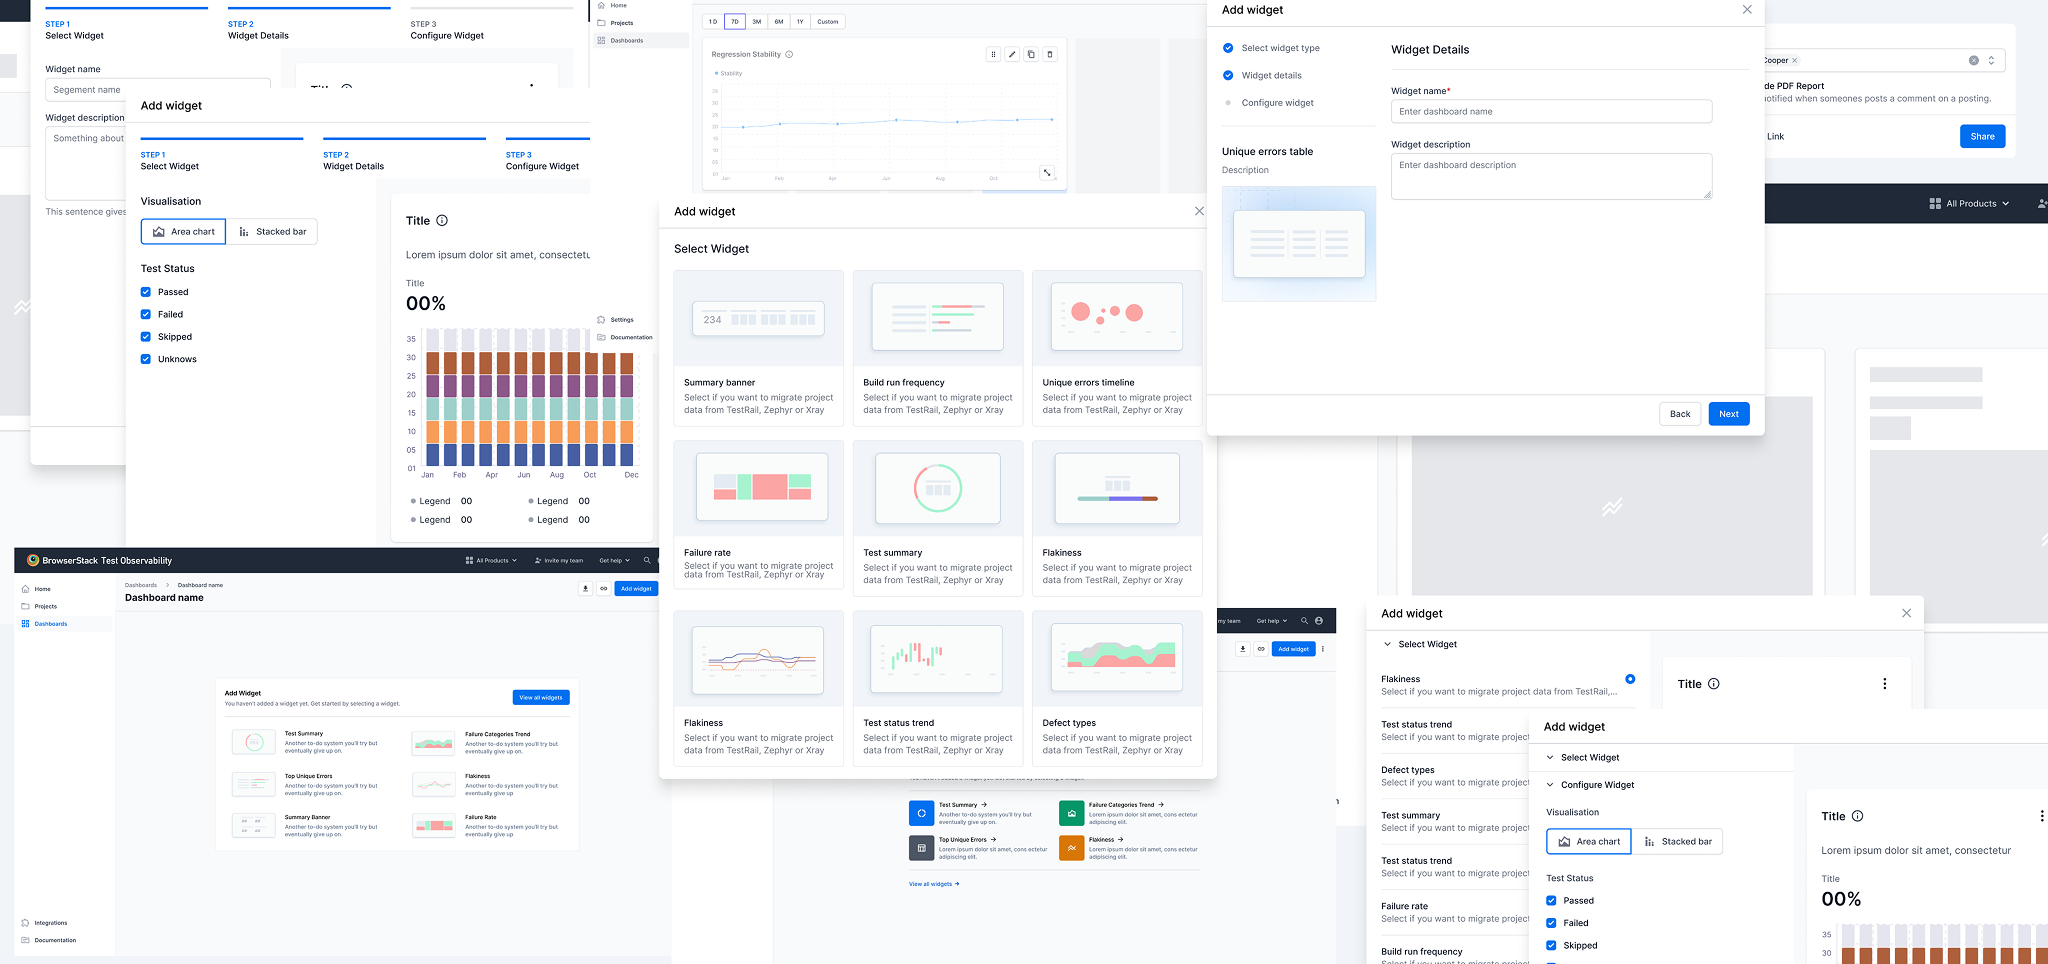
Although it may look straightforward, the process was jumbled up as any design process.
After several jamming sessions & reviews, I formed my opinion on the final solution
Final Solution
Design Showcase
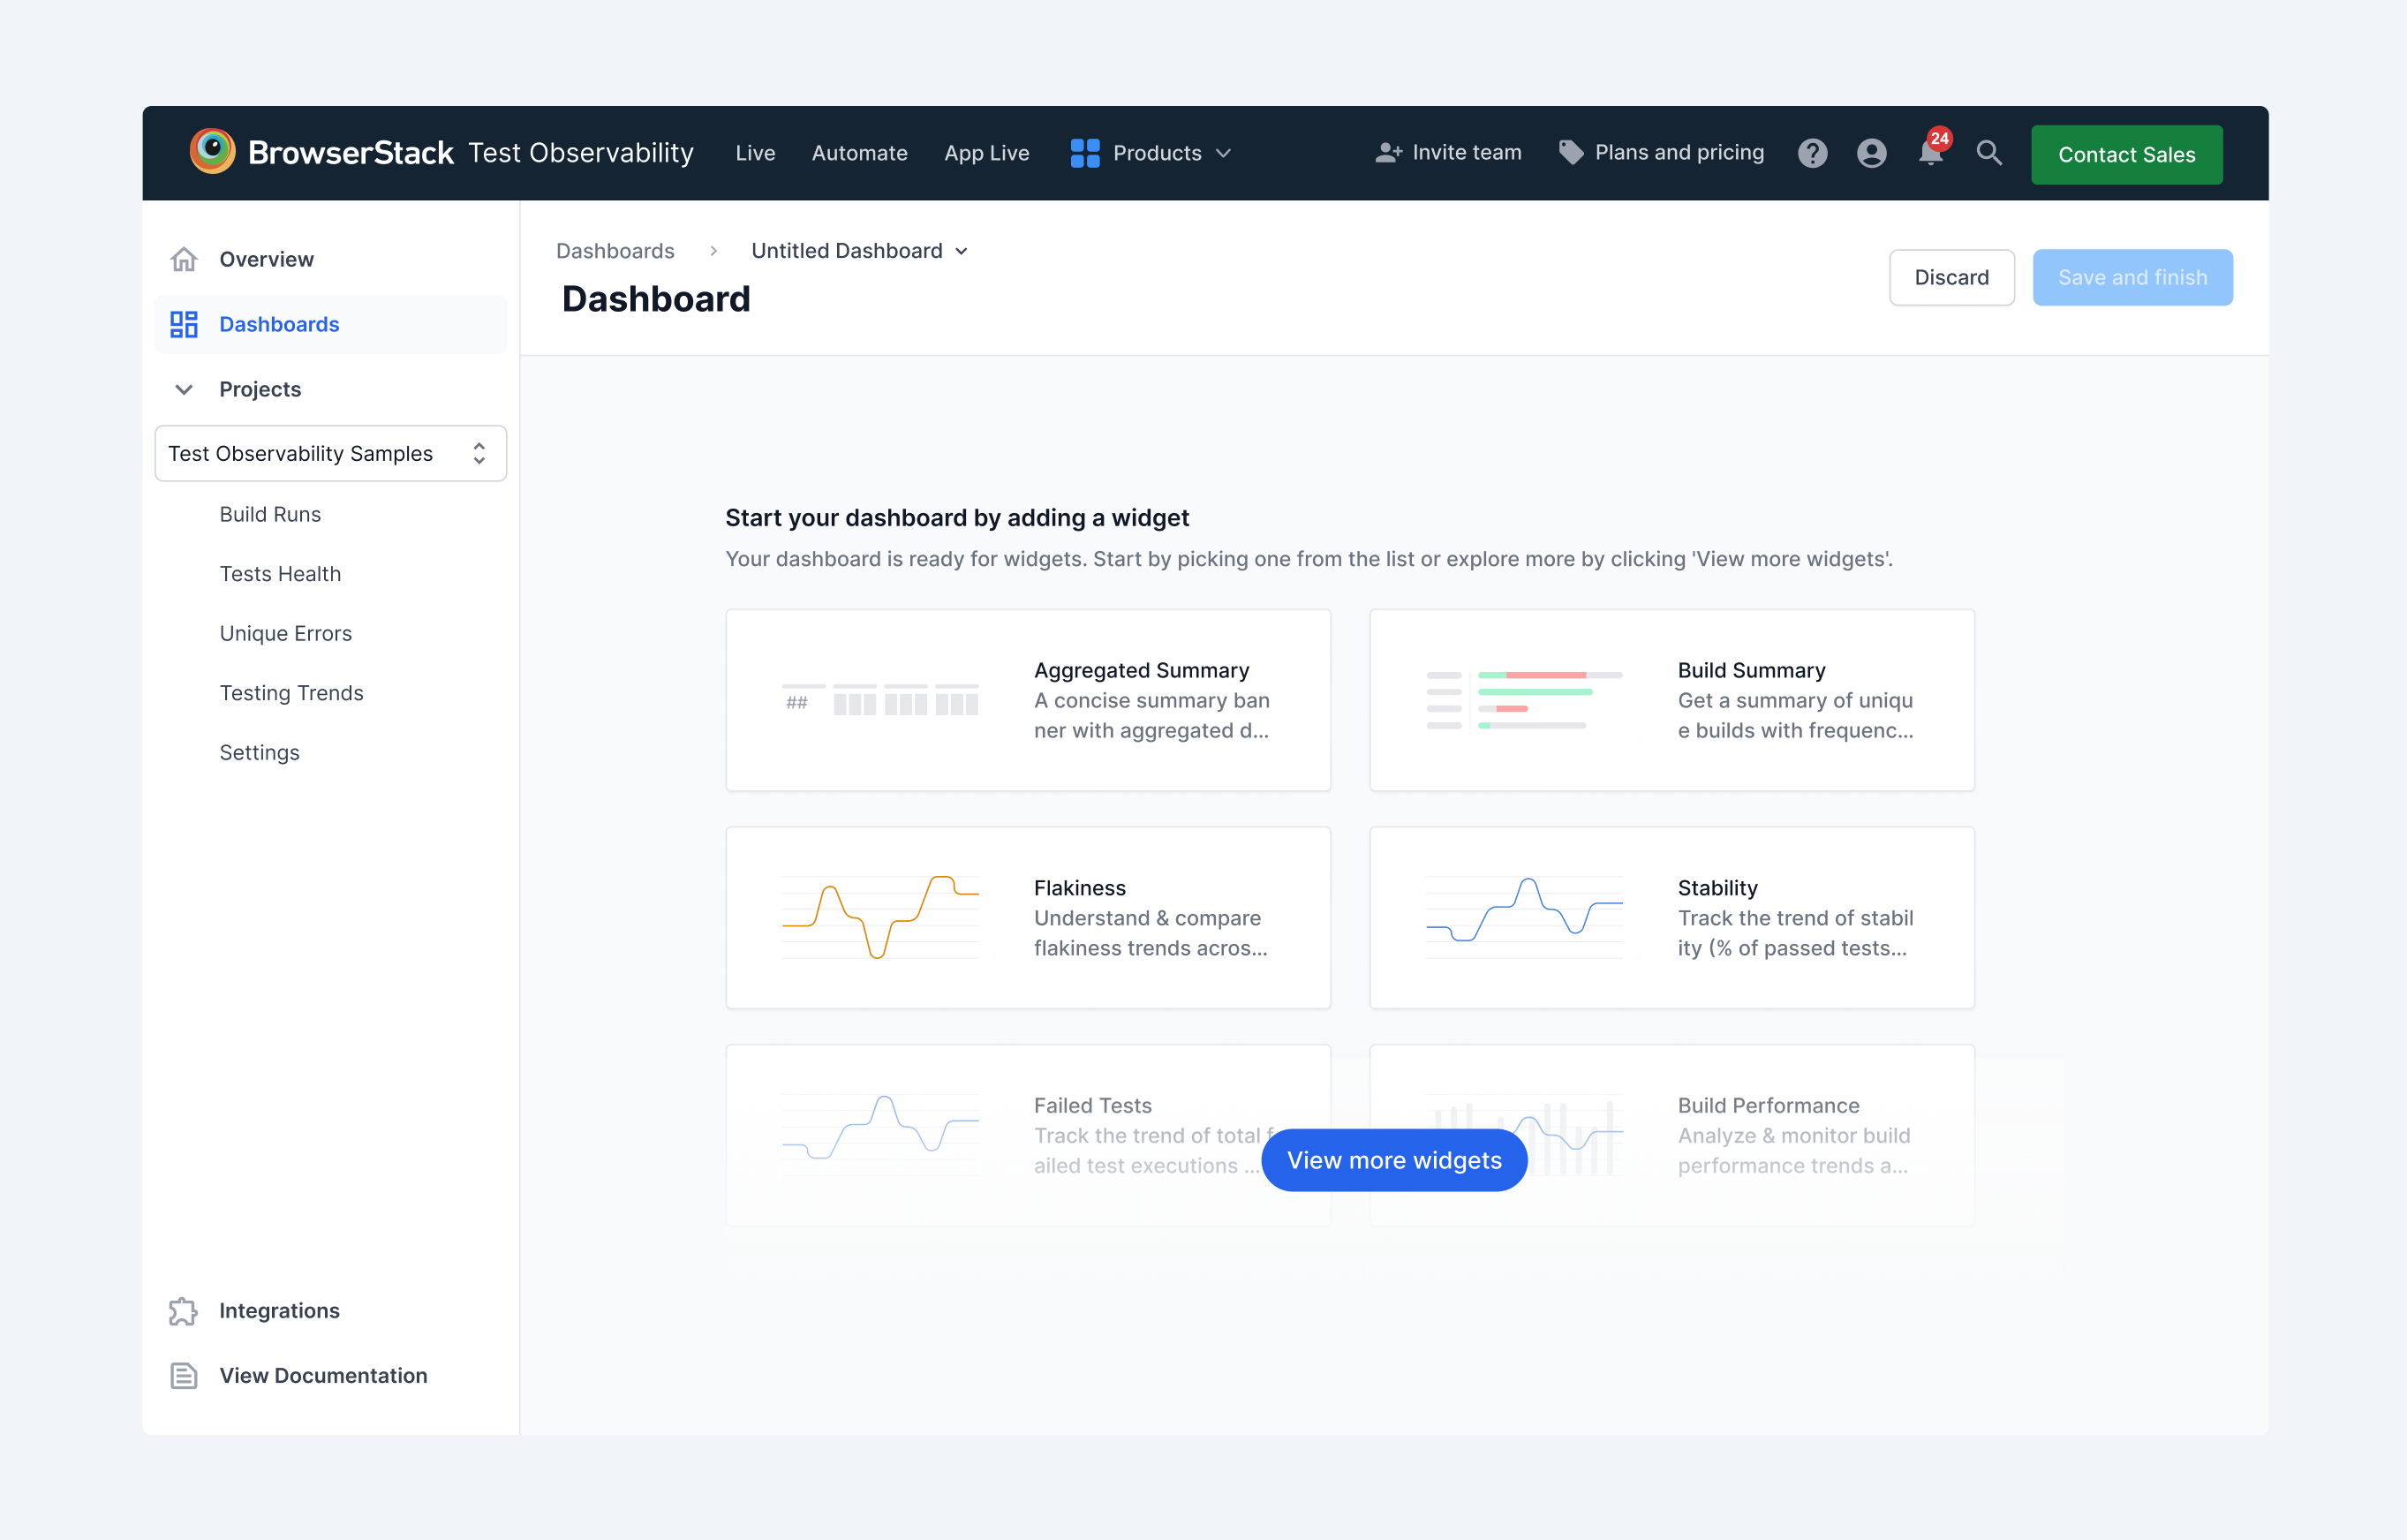
Frictionless Dashboard Creation
To reduce friction while dashboard creation we landed users directly in an empty dashboard with suggested widgets. This allowed them to begin building immediately, reducing hesitation.
Smoother Widget creation
Real time preview of the widget was a musthave. To align with engineering, I demonstrated the impact of additional clicks and referenced UX heuristics on system feedback. This helped gain buy-in for a more interactive widget creation process.

End to end customisability
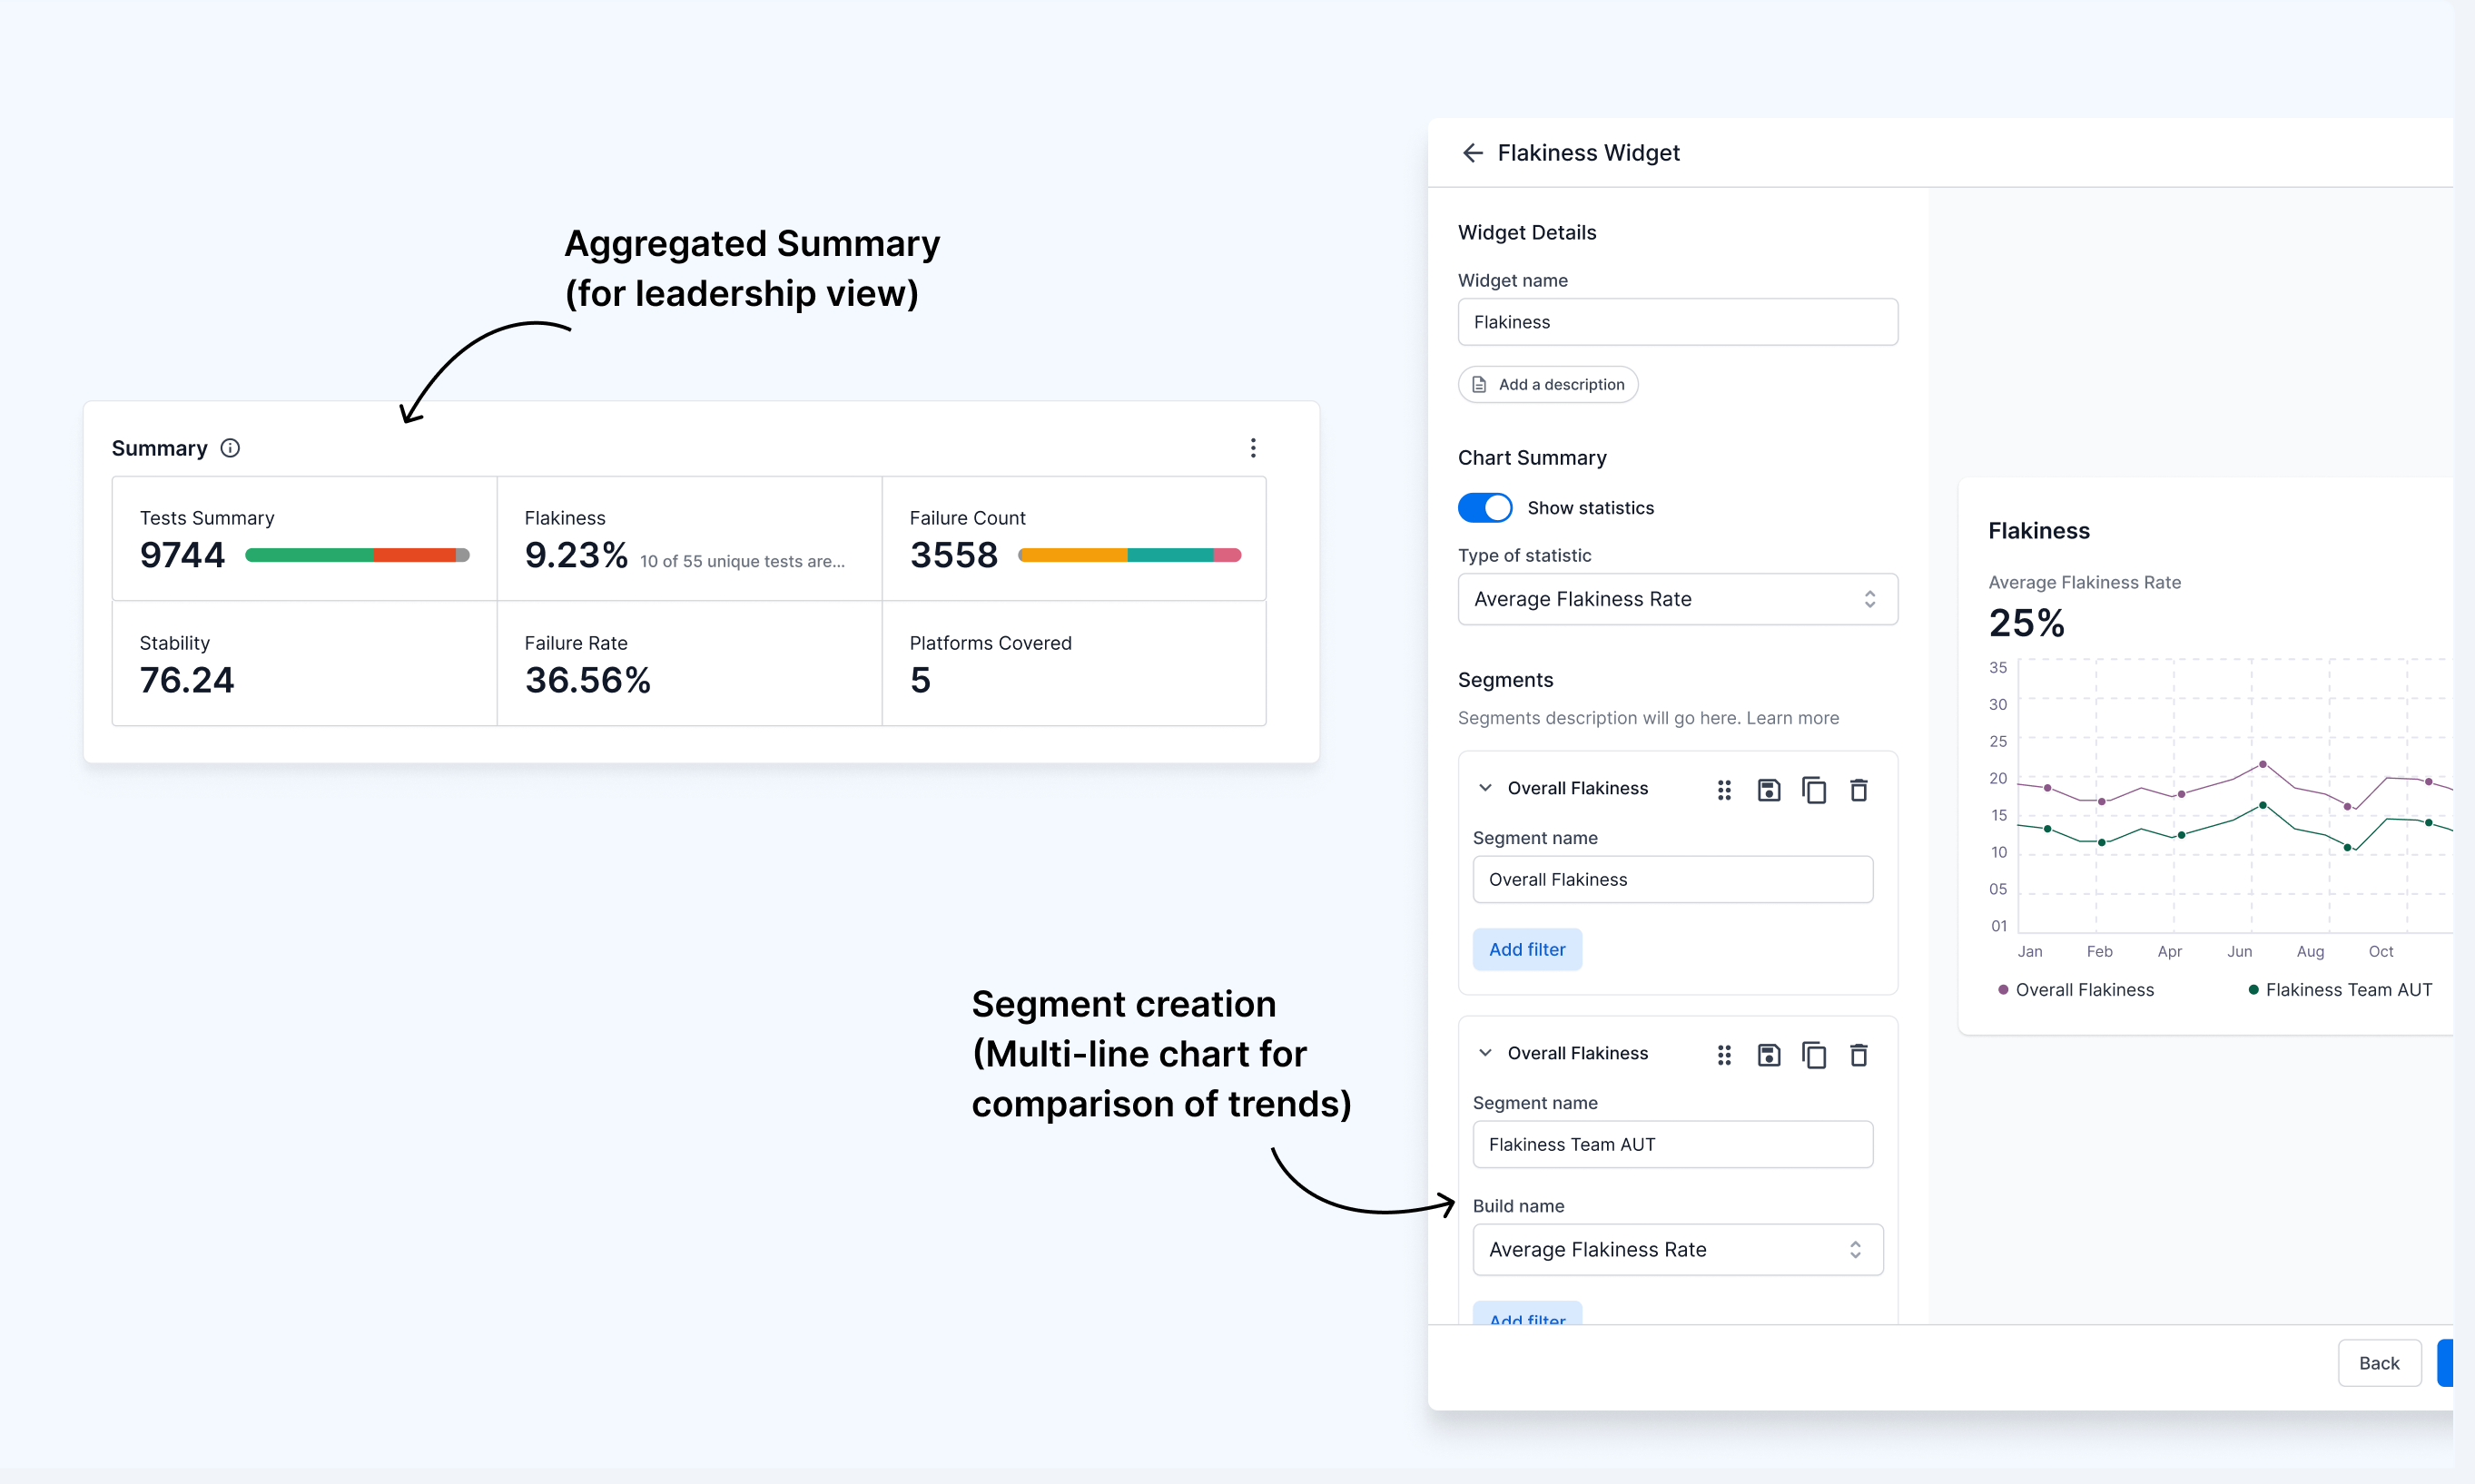
We solved multiline charts (segments), which provided a flexible way for users to represent their data and compare trends. Also powerful widgets such as summary banner and component summary highlight metrics enabled leadership view creation for QA managers